

Relative Value, Absolute Distortion
How the RVU Warped American Healthcare

In 1992, the U.S. healthcare system adopted a new framework for paying physicians under Medicare: the Resource-Based Relative Value Scale (RBRVS), built around a metric called the Relative Value Unit, or RVU. On its face, the RVU system seemed like a rational solution to a complex problem. Rather than letting physicians bill arbitrary amounts, the Centers for Medicare and Medicaid Services (CMS) would set uniform, nationally controlled prices for every service. Each procedure and office visit would be assigned a value, and payments would follow accordingly.1
But three decades later, this experiment in price control has mutated into a system that distorts medical practice, encourages the wrong incentives, and deforms the labor market for physicians. What began as a push for fairness and consistency has calcified into a centrally planned reimbursement regime that rewards procedures over thought, volume over value, and compliance over innovation.2
What Is an RVU?
An RVU is a unit of measure meant to quantify the value of a physician service. That value is not determined by the market or economic forces; it is decided in Washington by committees and lobbyists. Each medical service is assigned a number of RVUs based on three components:
Physician Work RVUs – accounting for the time, skill, intensity, and training involved in the service
Practice Expense RVUs – covering overhead such as office rent, equipment, and staff
Malpractice RVUs – reflecting the cost of professional liability insurance3
These are then adjusted by geography and multiplied by the Medicare conversion factor, a dollar amount set each year by CMS.4 The formula looks like this:
Payment = [(Work RVU + Practice Expense RVU + Malpractice RVU) × Geographic Adjustment] × Conversion Factor
So, for example, a moderate complexity primary care office visit (CPT code 99214) in 2024 has roughly:
Work RVUs: 1.5
Practice Expense RVUs: 1.0
Malpractice RVUs: 0.1
Total: 2.6 RVUs5
With the current 2025 Medicare conversion factor of $32.35, and assuming a neutral geographic adjustment (1.0), the total reimbursement would be:
2.6 × $32.35 = $84.11
But that is not what the physician takes home.6
Who Gets Paid—and How Much
First, this payment is typically made to the physician’s employer or medical group, not the physician directly. From that amount, overhead costs are subtracted, including staffing, supplies, electronic medical records, billing departments, compliance personnel, and hospital or health system administrative fees. What’s left may be split among multiple clinicians or used to fund a salary pool.7
The physician’s actual pay for that visit is often just a fraction of the billed amount, usually as little as 20 to 30 percent.8 So, for the moderate complexity primary care visit, which typically involves about 15-20 minutes in the room with the patient and another 10-20 minutes working in the electronic medical record, the physician would typically be paid about $20-$25 out of the roughly $84 billed for professional fees.
The Conversion Factor: A Race to the Bottom
The Medicare conversion factor—the number that converts RVUs into dollars—is not stable. It changes every year as part of the Medicare Physician Fee Schedule, and in recent years, it has mostly gone down.9 That’s because of a policy called budget neutrality.10
Under this rule, if new services are added to the fee schedule or if overall utilization goes up, the conversion factor must be adjusted downward so that total Medicare spending remains constant. In other words, as physicians collectively provide more care to more people, the system pays less per service to make up for it and to try to keep the Medicare budget stable.11
This creates a perverse incentive. To maintain their income, physicians must see more patients, perform more services, and increase their throughput just to stay even. What’s more, if they succeed at that, the conversion factor is likely to decline again the following year, forcing them to do even more. There is no upward adjustment for inflation or cost of living. It’s a hamster wheel disguised as a salary scale.12
In 1999, the conversion factor stood at approximately $34.73, peaked near $38.26 in 2001, and has since eroded to $32.35 in 2025. Meanwhile, general prices have risen cumulatively by over 80%, leaving the inflation-adjusted value of the conversion factor about 10% lower than it was in 1998.13
To illustrate the scope of the problem, below is a graph of the Medicare conversion factor, plotted in blue, against what the conversion factor should be if it were appropriately adjusted for inflation. To keep pace with inflation, the conversion factor should be roughly double what it is today:

How RVU Values Are Set
The RVU assigned to each service is not determined by CMS directly but rather by a committee of the American Medical Association called the Relative Value Scale Update Committee, or RUC.14 This group, composed largely of specialists representing various medical societies, meets behind closed doors to recommend RVU assignments and adjustments to CMS. Historically, CMS accepts the RUC’s recommendations more than 90% of the time.15
The process is opaque and skewed in favor of procedural specialties.16 A 5-minute dermatologic procedure can be assigned more RVUs than a complex 30-minute internal medicine visit involving multiple chronic conditions. The incentives are clear: procedures pay more, and the system increasingly rewards doing things to patients, rather than thinking, listening, or coordinating care for them.17
Why It Distorts the Market
Imagine a retail economy where every item’s price was set not by the seller or the customer, but by a committee in Washington composed mostly of luxury brand executives. T-shirts would be undervalued. Wristwatches and handbags would be lavishly priced. And the only way to earn a living as a merchant would be to stop selling necessities and start pushing luxury goods.
That is the healthcare labor market in America today. A primary care physician might be paid less for managing five complex diabetic patients than a cardiologist earns from inserting one stent.18 Students see this, and they choose accordingly. Faced with crushing debt loads and financial uncertainty, fewer medical graduates go into family medicine, geriatrics, or psychiatry.19 The system doesn’t reward value, it rewards volume and interventions.
Even worse, price signals are distorted. Patients do not know what they will pay. Physicians do not know what they will be paid. And no one—not even CMS—can reliably predict how adjustments to one part of the schedule will cascade through the rest. The result is a market that feels rigged, irrational, and increasingly inaccessible.20
The Case for Market-Based Reform
Critics of the free market often say that healthcare is too important to leave to supply and demand, but what the RVU system shows is that central planning has not created fairness or efficiency. It has created a brittle system built on political compromise, where bureaucrats and committees decide what care is “worth” and the patient has no meaningful say.
A truly market-based system would restore price transparency, competition, and choice. It would let physicians innovate in how they deliver care, and let them get paid for outcomes and efficiency, not just billing codes. It would let patients weigh price and quality the way they do for every other essential service in their lives.
Markets reward excellence. Bureaucracies reward conformity. Central price-setting is what keeps a primary care visit priced below a Botox injection, and what keeps hospital executives guessing at how many procedures they must squeeze in next quarter to hit a budget. It’s why patients are rushed, doctors are burned out, and care feels more transactional than personal.
Healthcare has become the only sector in American life where more money buys worse results. While consumers enjoy cheaper flights, faster phones, and sharper TVs, which are products of open competition and clear pricing, our centrally priced health system grows costlier, more confusing, and less humane.21
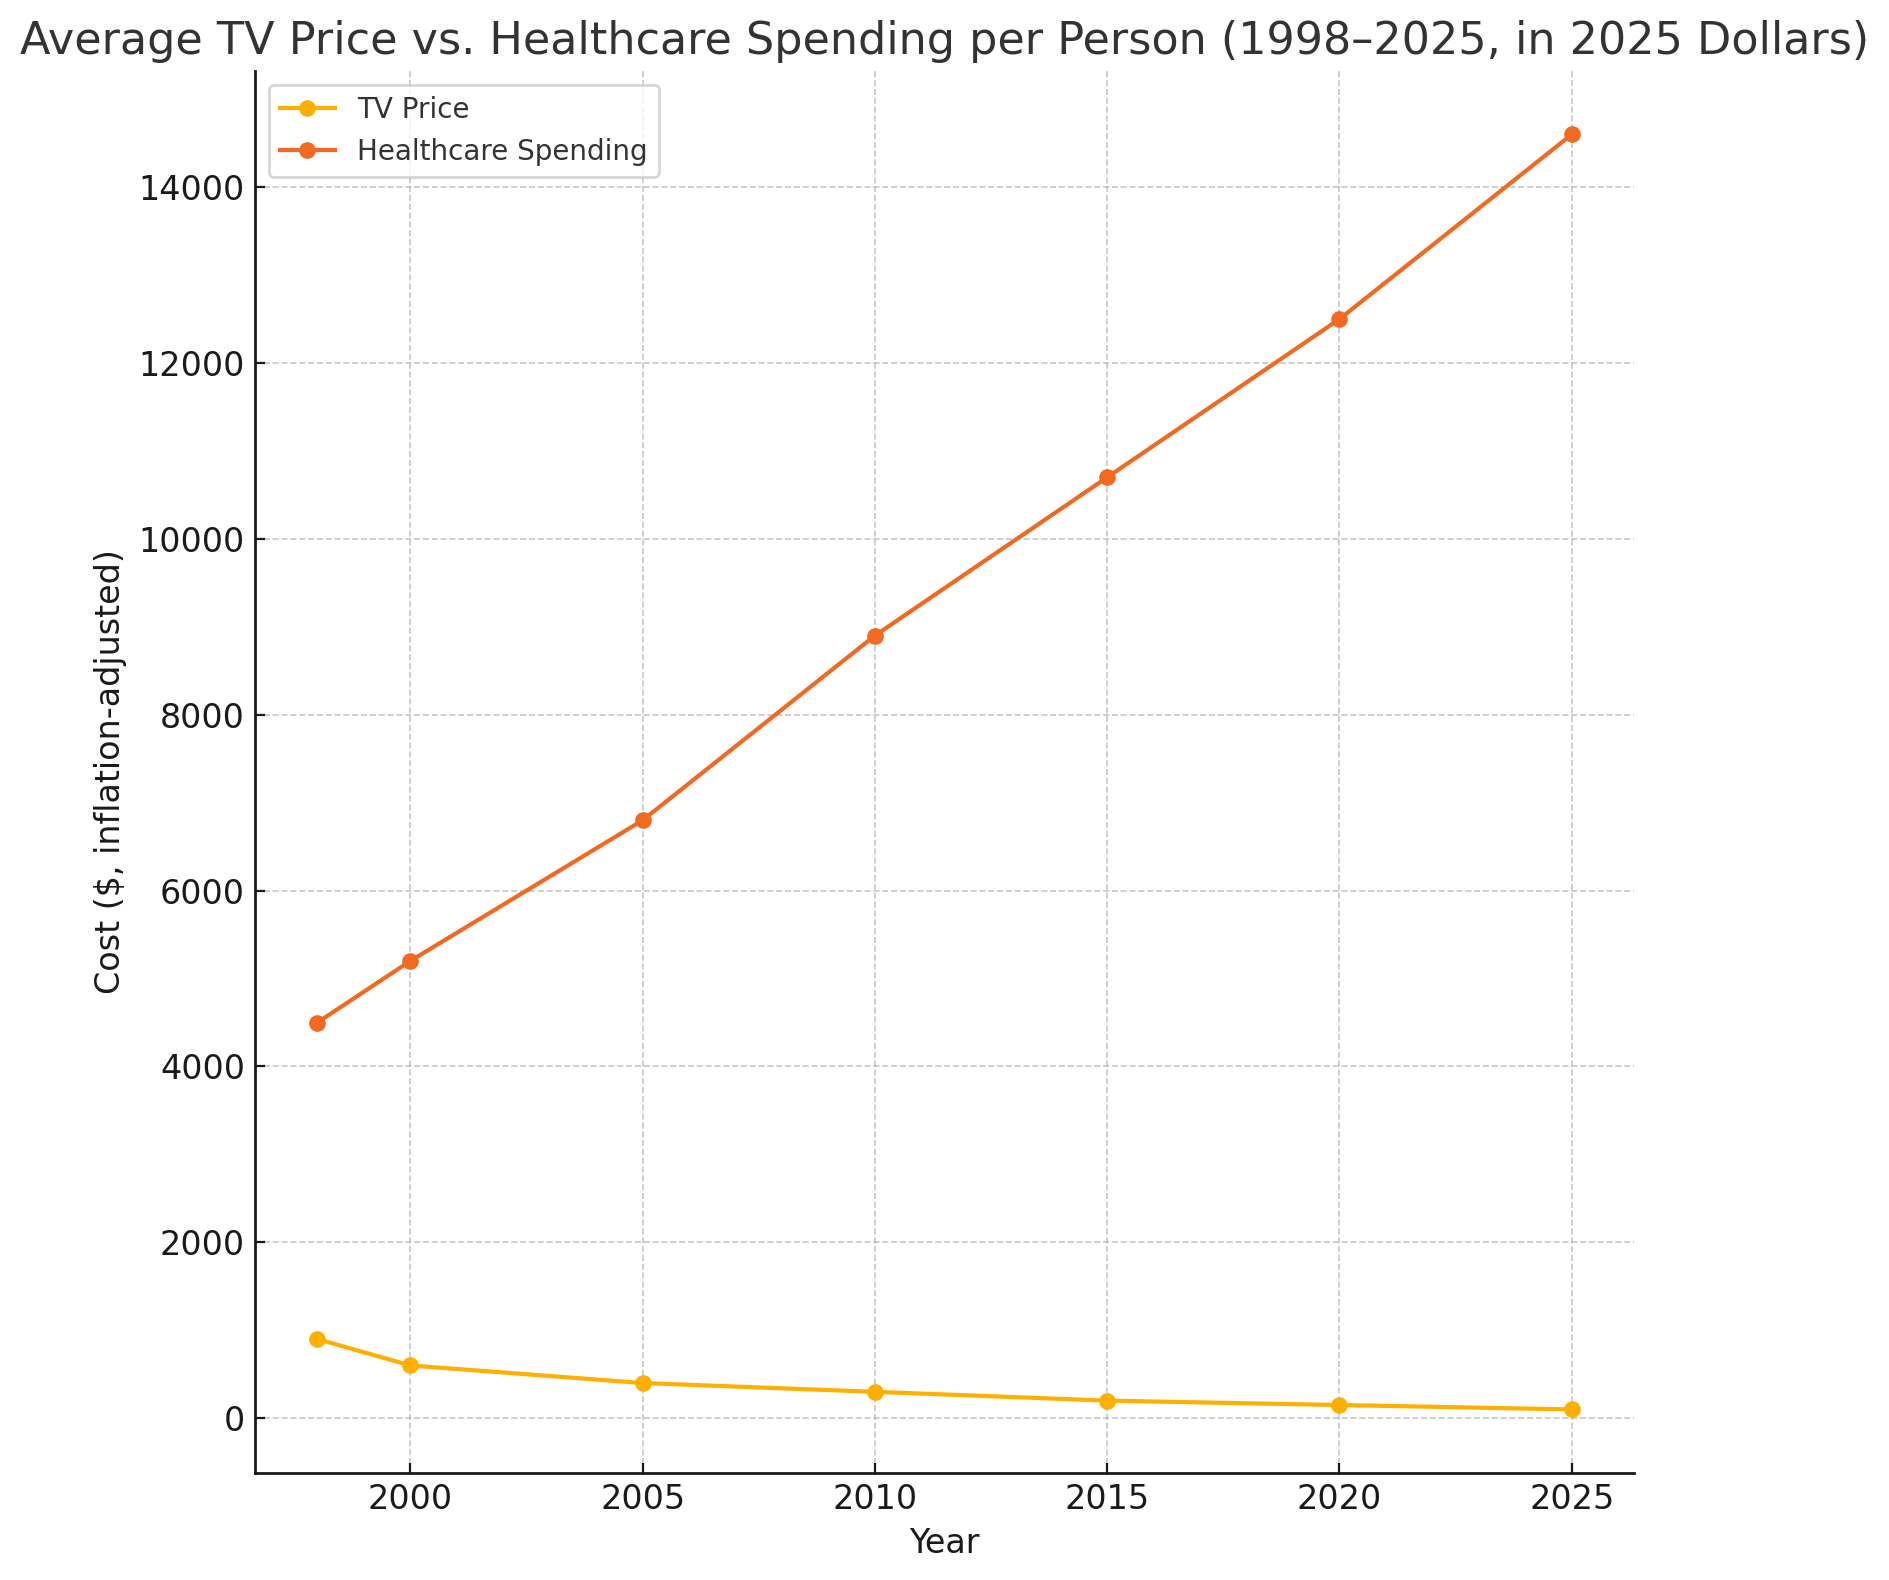
Imagine if buying a TV were like seeking medical care: no posted prices, no way to compare models, no idea what you’ll owe until weeks later. Yet in the real-world unregulated TV market, the products have improved exponentially while prices have dropped. What was once a luxury item exclusively accessible to the wealthy is now enjoyed even by households of very modest means. In healthcare, where prices are centrally set and shielded from competition, the opposite has happened: care has become more expensive, more impersonal, less available, and less effective, all while Americans grow sicker.
Doctors aren’t free to innovate. Patients aren’t free to choose. The only ones thriving are the intermediaries managing the dysfunction. As it turns out, price controls don’t create value, they just hide its absence.
Centers for Medicare & Medicaid Services. Medicare Physician Fee Schedule Overview. https://www.cms.gov/medicare/physician-fee-schedule/
Fuchs VR, Milstein A. The $640 Billion Question—Why Does Cost-Effective Care Diffuse So Slowly? N Engl J Med. 2011;364(21):1985-1987.
American Medical Association. RBRVS Overview. https://www.ama-assn.org/about/rvs-update-committee-ruc/rvs-update-committee-ruc
CMS. Medicare Conversion Factor: Final Rule CY2024. https://www.cms.gov/newsroom/fact-sheets/calendar-year-cy-2024-medicare-physician-fee-schedule-final-rule
American Academy of Neurology. 2024 Medicare Physician Fee Schedule Table. https://www.aan.com/siteassets/home-page/tools-and-resources/2024-final-mpfs-rvu-and-%24-values.pdf
Centers for Medicare & Medicaid Services. Calendar Year (CY) 2025 Medicare Physician Fee Schedule Final Rule. https://www.cms.gov/newsroom/fact-sheets/calendar-year-cy-2025-medicare-physician-fee-schedule-final-rule
Bodenheimer T, Berenson RA, Rudolf P. The Primary Care-Specialty Income Gap: Why It Matters. Ann Intern Med. 2007;146(4):301–306.
Sinsky C, Dyrbye LN, West CP, Satele D, Shanafelt TD. Professional Satisfaction and the Income of Physicians. Mayo Clin Proc. 2022;97(3):488-499.
American Medical Association. History of the Medicare Conversion Factor. https://www.ama-assn.org/system/files/cf-history.pdf
American Medical Association. Medicare Basics: Budget Neutrality. https://www.ama-assn.org/system/files/medicare-basics-budget-neutrality.pdf
Zuckerman S, Merrell K, Berenson RA. Adjusting Medicare Physician Fees for Practice Cost Differences. Health Aff (Millwood). 2004;23(Suppl 2):W4-79.
American College of Cardiology. CMS Updates Medicare Conversion Factor. https://www.acc.org/Latest-in-Cardiology/Articles/2024/03/21/14/00/cms-updates-medicare-conversion-factor-for-remainder-of-2024
American Medical Association. History of Medicare Physician Payment: Conversion Factors 1992–2024. Published January 2024. Accessed June 14, 2025. https://www.ama-assn.org/system/files/cf-history.pdf
AMA. RVS Update Committee (RUC): Composition. https://www.ama-assn.org/about/rvs-update-committee-ruc/composition-rvs-update-committee-
Goodson JD. Unintended Consequences of Resource-Based Relative Value Scale Reimbursement. JAMA. 2007;298(19):2308–2310.
Mitchell JM, Hadley J, Gaskin DJ. Physicians’ Responses to Financial Incentives. Med Care. 2000;38(10):1029-1048.
Reschovsky JD, Cassil A, Pham HH. Physician Willingness and Resources to Serve More Medicaid Patients. Med Care Res Rev. 2010;67(4):560-577.
MedPAC. Report to the Congress: Medicare Payment Policy. March 2023. https://www.medpac.gov/document/march-2023-report-to-the-congress-medicare-payment-policy/
Association of American Medical Colleges. Medical Student Education: Debt, Costs, and Loan Repayment. https://www.aamc.org/data-reports/students-residents/report/debt-fact-card
Sinaiko AD, Rosenthal MB. Increased Price Transparency in Health Care — Challenges and Potential Effects. N Engl J Med. 2011;364(10):891-894.
OfficialData.org. Inflation-adjusted prices for televisions (1950–2025). Accessed June 14, 2025. https://www.in2013dollars.com/Televisions/price-inflation
Centers for Medicare & Medicaid Services. National Health Expenditure Data: Historical and Projected (1960–2025). Accessed June 14, 2025. https://www.cms.gov/data-research/statistics-trends-and-reports/national-health-expenditure-data/historical